Salesforce Inc CRM will be reporting its third-quarter earnings on Tuesday. Wall Street expects $2.44 in EPS and $9.34 billion in revenues as the company reports after market hours.
The stock is up 32.47% over the past year and 11.42% over the past month.
Let’s look at what the charts indicate for Salesforce stock and how the stock currently maps against Wall Street estimates.
Read Also: Salesforce Gears Up For Q3 Print; Here Are The Recent Forecast Changes From Wall Street’s Most Accurate Analysts
Salesforce Stock Chart Moderately Bullish Ahead Of Q3 Earnings
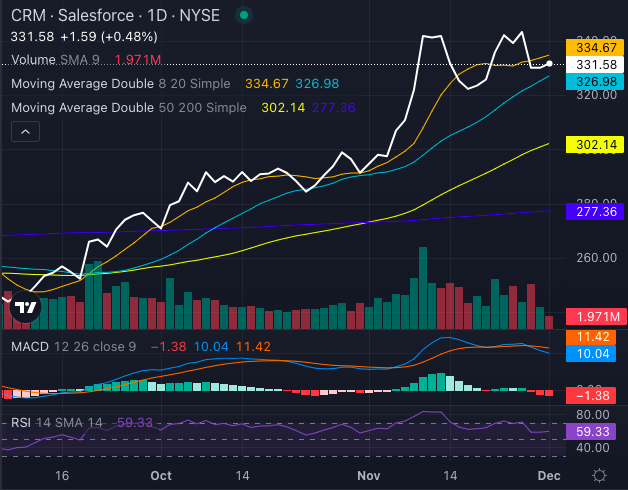
Salesforce stock is riding a moderately bullish wave heading into its earnings report.

Chart created using Benzinga Pro
The stock’s price of $331.58 is sandwiched between key moving averages, with a bearish signal from the eight-day SMA (simple moving average) at $334.67 but bullish signals from the 20-day SMA at $326.98 and the 50-day SMA at $302.14. The 200-day SMA at $277.36 further reinforces the long-term bullish momentum.
Technical indicators add to the optimism, with the MACD (moving average convergence/divergence) at 10.04, signaling strong momentum, and the RSI (relative strength index) at 59.33, suggesting the stock has room to run without overheating.
Despite mixed short-term signals, the broader trend leans firmly bullish.
Salesforce Analysts See 15% Upside
Ratings & Consensus Estimates: The consensus analyst rating on Salesforce stock is a Buy, with a price target of $343.91. The latest analyst ratings for Salesforce stock from Piper Sandler, Citigroup, and Truist Securities imply a 14.63% upside, with an average price target of $381.
CRM Price Action: Salesforce stock was up 0.3% at $331.19 at the time of publication Monday.
Read Next:
Photo: Shutterstock
Market News and Data brought to you by Benzinga APIs