While the holiday season tends to brighten spirits, love was certainly not in the air for Signet Jewelers Ltd SIG. Early last month, the diamond jewelry retailer posted disappointing results for its fiscal third quarter. Nevertheless, investors historically have bought extreme dips in SIG stock, opening the real possibility of a near-term bullish options strategy.
On paper, Signet posted adjusted earnings per share of 24 cents, missing Wall Street’s consensus view of 33 cents. On the top line, the company rang up sales of $1.35 billion, which unfortunately represented a 3.1% year-over-year decline. As well, this figure missed analysts’ revenue target of $1.37 billion.
During the conference call, Signet CFO Joan Hilson remarked that the competitive environment dragged down the Q3 print. What also sent investors rushing for the exits was management guiding current-quarter sales to a range between $2.38 billion and $2.46 billion. Previously, the consensus stood at $2.45 billion.
Still, the market tends to move on anticipated events. Given that the poor print is now in the rearview mirror, traders may consider looking at SIG stock from a fresh perspective.
Fundamental and Technical Underpinnings Point Northward for SIG Stock
To be sure, the dynamic political and economic ecosystem presents significant concerns for investors. Nevertheless, key datapoints suggest that consumer sentiment is generally improving, which may have positive implications for Signet’s core business. After all, academic research indicates an inverse correlation between rising unemployment and odds of marriage.
Recently, the stronger-than-expected December Purchasing Managers’ Index highlighted resilience in the U.S. services sector. Further, the Bureau of Labor Statistics released its Job Openings and Labor Turnover Survey data for November, revealing that the namesake metric rose by 259,000 to 8.1 million. This figure exceeded market expectations of 7.7 million.
It should be noted that vacancies increased for white-collar categories, such as professional and business services and finance and insurance. Put another way, the vacancies were tied to sectors that younger workers prefer.
Beyond the fundamentals, investors may also take confidence in the technical framework of SIG stock. For the past 20 years, SIG commands an upward bias when viewed from a month-over-month performance basis. Specifically, out of 252 months, 136 posted a positive return on a sequential basis, thus yielding bullish probabilities of nearly 54%.
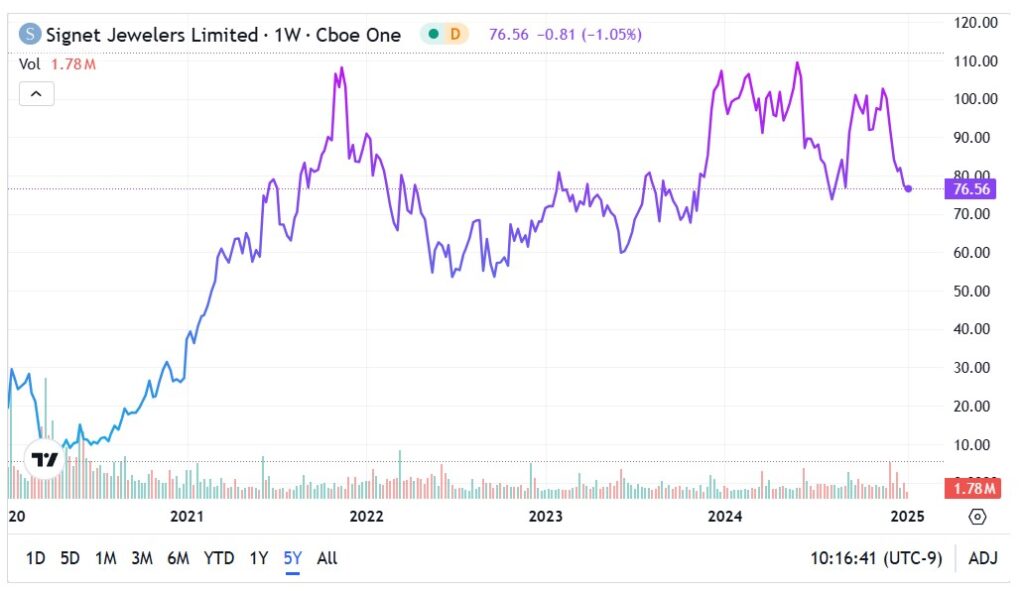
Intriguingly, the aforementioned upward bias improves whenever SIG stock encounters severe monthly volatility. For example, last month, SIG suffered a drop of just under 20%. Since January 2004, there have been 22 instances when Signet stock incurred a one-month decline of 15% or worse. Out of this tally, 14 subsequent months saw a positive return or 63.64% of the time. Moreover, the average positive return landed at 18%.
Of course, history isn’t guaranteed to repeat. But the combination of supportive fundamentals and the technical dip-buying tendency bodes favorably for SIG stock.
Also Read: Are Regional Banks The Next Big Opportunity? Why Wall Street Analysts Expect Multiyear Rally
A High-Risk, High-Reward Call Spread Beckons
Recognizing that the market tends to get greedy when extreme fear strikes SIG stock, daring speculators may consider an options strategy called the bull call spread. This multi-leg transaction involves buying a call option and simultaneously selling a call at a higher strike price for the same expiration date. Here, traders can discount their long position by using the credit from the short call to partially offset the debit paid for the long call.
Assuming prior statistical trends play out, by the end of this month, SIG stock could be up 18% against December’s close or around $95.24. To provide some margin for error, aggressive traders may consider the 85/90 bull call spread (buy the $85 call, sell the $90 call) for the options chain expiring Feb. 21, 2025.
The above transaction provides a month-and-a-half for the bullish thesis to pan out, enabling traders the potential choice of exiting the position early. Also, SIG would only need to hit $90 (an 11.5% increase from December’s final session) to receive the maximum reward.
To be upfront, the time-of-writing max payout of almost 355% indicates that market makers believe SIG stock hitting $90 by expiration to be a low-probability event. However, the counterargument is that the combination of improving fundamentals and a technical tendency of extreme-value hunting makes for a surprisingly tempting transaction.
Read Next:
Photo by JHVEPhoto via Shutterstock.
© 2025 Benzinga.com. Benzinga does not provide investment advice. All rights reserved.
5 Stocks Our Experts Predict Could Double In the Next Year
By submitting your email, you'll also get a free pivot & flow membership. A free daily market overview. You can unsubscribe at any time.