Oracle Chart Flatlines As Death Cross Adds To Tech Stock’s Tough Month – Oracle (NYSE:ORCL)

Photo of author

By Ronald Tech

Oracle Corp ORCL stock just flashed a Death Cross, and the chart tells a very different story for a company trying to rewrite its cloud destiny.

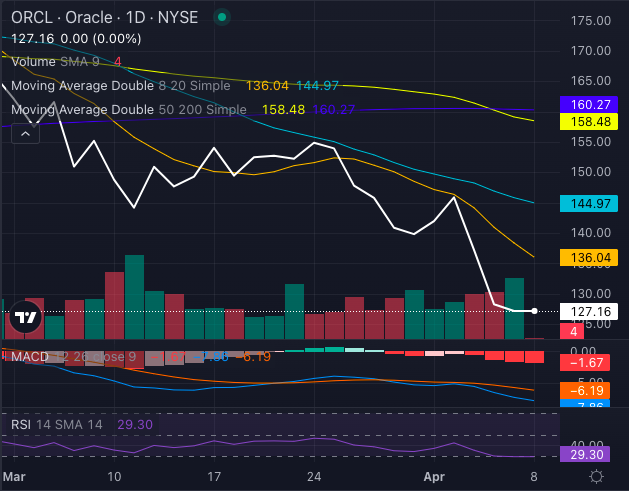
Chart created using Benzinga Pro

Oracle stock, at $127.16, is well below its 50-day simple moving average (SMA) of $158.48 and 200-day SMA of $160.27. When a stock’s 50-day average drops below the 200-day, it triggers what technical analysts call a death cross – and it’s not exactly a sign of bullish momentum.

Read Also: $74 Billion Wiped Out Since Tariff Declaration — See How Much The Billionaires Lost

All Signals Point Bearish – Despite A Tuesday Bounce

Even with a brief 3.83% pop on Tuesday morning, Oracle stock remains down over 20% year to date and has shed more than 11% in the past month. The trend is considered strongly bearish, with the share price trading under its eight, 20 and 50-day SMAs.

Oracle stock’s Relative Strength Index (RSI) of 29.30 suggests the stock is oversold, while a Moving Average Convergence Divergence (MACD) of a negative 7.86 reinforces the bearish tone.

Simply put, the technical backdrop is grim – and buyers seem to be lurking, but not committing.

Cloud Ambitions In A Tiered Universe

Fundamentally, it’s not all bad news. Cantor Fitzgerald just reaffirmed its ‘Overweight’ rating, citing Oracle’s expanding footprint in cloud infrastructure. But context matters. While Amazon.com Inc‘s AMZN Amazon Web Services and Microsoft Corp‘s MSFT Azure dominate as tier-one providers, Oracle is still fighting for relevance – sitting in the third tier behind Alphabet Inc‘s GOOGL GOOG Google Cloud Platform.

See also  Wealth Tax: Debating the Top Tax Bracket Debate Over the Wealth Tax

Are the wealthy getting away with not paying their fair share of taxes, or are they carrying an unfair burden? The debate over the top tax bracket rages on as concerns about income inequality and the concentration of wealth at the top of the economic ladder continue to make headlines. Senators Bernie Sanders and Elizabeth Warren have both proposed a wealth tax on the ultra-rich, while even multi-billionaire Warren Buffett has vocally expressed support for the idea, suggesting that it is fair for wealthy Americans to be taxed at a higher rate.

Currently, the top federal income tax rate stands at 37%, applicable to incomes of $539,000 and higher for single taxpayers and $647,850 and higher for couples filing jointly. However, historical data reveals that the top marginal tax rate has been significantly higher in previous eras. In 1944 and 1945, it peaked at a staggering 94%, and in the late 1980s, it hit a low of 28% under former President Ronald Reagan.

Historical Context and Present Day

The taxation of the wealthy has fluctuated significantly throughout U.S. history, demonstrating both higher and lower levels of taxation than the current status. This historical perspective adds complexity to the ongoing debate regarding whether the rich are paying their fair share of taxes. Despite the disputes, recent data from the IRS sheds light on the current tax scenario.

Top 1% Tax Contributions

In 2020, the top 1% of taxpayers—those earning $561,351 or more—contributed a significant 42.3% of the total tax revenue collected. This translates to the top 1% paying more income taxes than the bottom 90% combined. Astonishingly, the top 1% paid a staggering $723 billion in income taxes, while the bottom 90% collectively contributed $450 billion.

State-Level Analysis

Examining the tax burden on the wealthiest individuals at the state level yields interesting findings:

Alabama Minimum income to be considered 1%: $404,560 Average income of the 1%: $1,107,769 Average income tax paid by the 1%: $263,845 Average tax rate of the 1%: 23.82% Alaska Minimum income to be considered 1%: $466,905 Average income of the 1%: $999,772 Average income tax paid by the 1%: $253,754 Average tax rate of the 1%: 25.38% Arizona Minimum income to be considered 1%: $485,146 Average income of the 1%: $1,464,848 Average income tax paid by the 1%: $369,426 Average tax rate of the 1%: 25.22% Arkansas Minimum income to be considered 1%: $387,666 Average income of the 1%: $1,483,925 Average income tax paid by the 1%: $313,266 Average tax rate of the 1%: 21.11% California Minimum income to be considered 1%: $726,188 Average income of the 1%: $2,430,790 Average income tax paid by the 1%: $655,180 Average tax rate of the 1%: 26.95% Colorado Minimum income to be considered 1%: $609,919 Average income of the 1%: $1,799,148 Average income tax paid by the 1%: $465,284 Average tax rate of the 1%: 25.86% Analysis of Minimum Income of the Wealthiest 1% and Average Tax Rates by State Analysis of Minimum Income of the Wealthiest 1% and Average Tax Rates by State

Oracle’s cloud push has leaned heavily on its GPU hardware capabilities and generous discounting to draw in customers. The effort is slowly moving it beyond its legacy base, but Wall Street isn’t seeing a near-term payoff just yet.

Strong Margins, Weak Momentum

Oracle still boasts a hefty market cap of $368 billion and an enviable gross profit margin of 71.12%.

But even strong fundamentals can’t hide from a faltering chart. Right now, Oracle’s numbers look better on paper than they do in pixels.

Read Next:

Image: Shutterstock

Stock Score Locked: Want to See it?

Benzinga Rankings give you vital metrics on any stock – anytime.

Reveal Full Score

Market News and Data brought to you by Benzinga APIs