Netflix Is Squid-Gaming The Market – And Winning – Netflix (NASDAQ:NFLX)

Photo of author

By Ronald Tech

Netflix Inc NFLX is doing just fine, thank you very much. While other streamers fight over scraps, the OG is stacking subscribers, content, and cash – and throwing punches with live sports and games too.

Fresh off a beat on both top and bottom lines for the first quarter, the stock surged above all key moving averages, flashing a “strongly bullish” signal across the board.

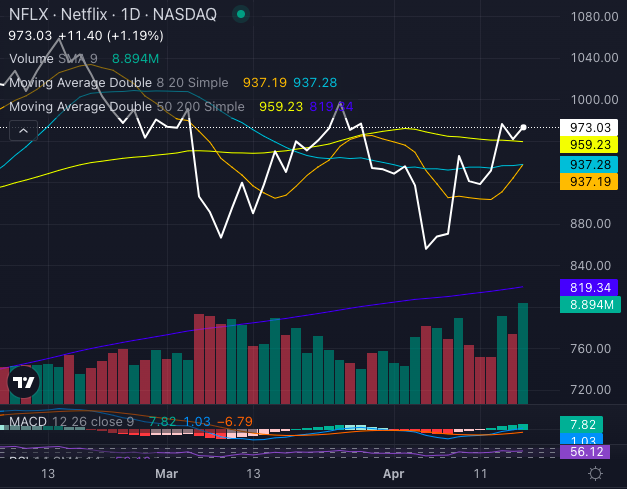
Chart created using Benzinga Pro

As Ed Egilinsky, Managing Director at Direxion, put it: “NFLX is experiencing slight buying pressure”—but it’s clear investors are feeling more than slightly confident.

Instead of obsessing over sub counts (which it’s no longer disclosing quarterly), Netflix focused on the future: “We remain optimistic about our 2025 slate,” the company said, highlighting returning hits, surprises, and the highly anticipated “Squid Game” Season 3 – set to drop on June 27.

Read Also: Netflix Confident Of Its ‘Incredible Entertainment Value’ As Recession Fears Intensify, Greg Peters Says $7.99 Ad Plan Engagement Remains ‘Strong And Healthy’

Not to be outdone, the company is also bringing NFL football to Christmas Day, and just launched its in-house ad tech, signaling it’s not just playing in the advertising arena—it’s aiming to control the field.

And let’s not forget games. “Squid Game: Unleashed” has already been a smash hit, and new content is syncing up with the show’s return. In the battle for attention, Netflix isn’t just streaming—it’s scheming.

With the stock now trading at $973.03 – well above its eight, 20, 50 and 200-day SMAs (simple moving averages) – momentum looks unstoppable. And with 2025 revenue guidance locked in at up to $44.5 billion, Netflix is streaming confidence straight into investors’ portfolios.

See also  Wealth Tax: Debating the Top Tax Bracket Debate Over the Wealth Tax

Are the wealthy getting away with not paying their fair share of taxes, or are they carrying an unfair burden? The debate over the top tax bracket rages on as concerns about income inequality and the concentration of wealth at the top of the economic ladder continue to make headlines. Senators Bernie Sanders and Elizabeth Warren have both proposed a wealth tax on the ultra-rich, while even multi-billionaire Warren Buffett has vocally expressed support for the idea, suggesting that it is fair for wealthy Americans to be taxed at a higher rate.

Currently, the top federal income tax rate stands at 37%, applicable to incomes of $539,000 and higher for single taxpayers and $647,850 and higher for couples filing jointly. However, historical data reveals that the top marginal tax rate has been significantly higher in previous eras. In 1944 and 1945, it peaked at a staggering 94%, and in the late 1980s, it hit a low of 28% under former President Ronald Reagan.

Historical Context and Present Day

The taxation of the wealthy has fluctuated significantly throughout U.S. history, demonstrating both higher and lower levels of taxation than the current status. This historical perspective adds complexity to the ongoing debate regarding whether the rich are paying their fair share of taxes. Despite the disputes, recent data from the IRS sheds light on the current tax scenario.

Top 1% Tax Contributions

In 2020, the top 1% of taxpayers—those earning $561,351 or more—contributed a significant 42.3% of the total tax revenue collected. This translates to the top 1% paying more income taxes than the bottom 90% combined. Astonishingly, the top 1% paid a staggering $723 billion in income taxes, while the bottom 90% collectively contributed $450 billion.

State-Level Analysis

Examining the tax burden on the wealthiest individuals at the state level yields interesting findings:

Alabama Minimum income to be considered 1%: $404,560 Average income of the 1%: $1,107,769 Average income tax paid by the 1%: $263,845 Average tax rate of the 1%: 23.82% Alaska Minimum income to be considered 1%: $466,905 Average income of the 1%: $999,772 Average income tax paid by the 1%: $253,754 Average tax rate of the 1%: 25.38% Arizona Minimum income to be considered 1%: $485,146 Average income of the 1%: $1,464,848 Average income tax paid by the 1%: $369,426 Average tax rate of the 1%: 25.22% Arkansas Minimum income to be considered 1%: $387,666 Average income of the 1%: $1,483,925 Average income tax paid by the 1%: $313,266 Average tax rate of the 1%: 21.11% California Minimum income to be considered 1%: $726,188 Average income of the 1%: $2,430,790 Average income tax paid by the 1%: $655,180 Average tax rate of the 1%: 26.95% Colorado Minimum income to be considered 1%: $609,919 Average income of the 1%: $1,799,148 Average income tax paid by the 1%: $465,284 Average tax rate of the 1%: 25.86% Analysis of Minimum Income of the Wealthiest 1% and Average Tax Rates by State Analysis of Minimum Income of the Wealthiest 1% and Average Tax Rates by State

As the company puts it, it’s building “the most valued entertainment company for members, creators and shareholders.” So far, mission very much accomplished.

Read Next:

Image: Shutterstock/Vantage_DS

Stock Score Locked: Want to See it?

Benzinga Rankings give you vital metrics on any stock – anytime.

Reveal Full Score

Market News and Data brought to you by Benzinga APIs

5 Stocks Our Experts Predict Could Double In the Next Year

By submitting your email, you'll also get a free pivot & flow membership. A free daily market overview. You can unsubscribe at any time.