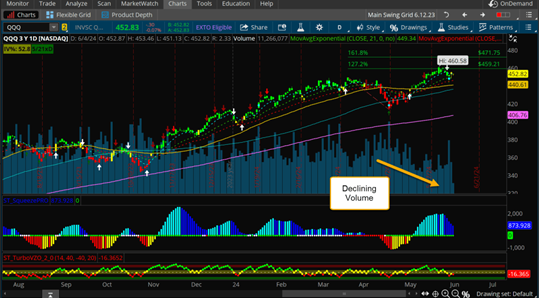
Examine a chart of the Invesco QQQ Trust below, with volume overlayed in blue. Observing this chart can offer insights into peak volume days (usually during market pullbacks) and trends in volume.
Heightened volume typically indicates increased volatility and directional trading opportunities. Conversely, declining volume often signifies reduced directional opportunities.
Consider the daily VIX chart. As QQQ volume fell to yearly lows, the VIX also dropped to its yearly low of 11.52.
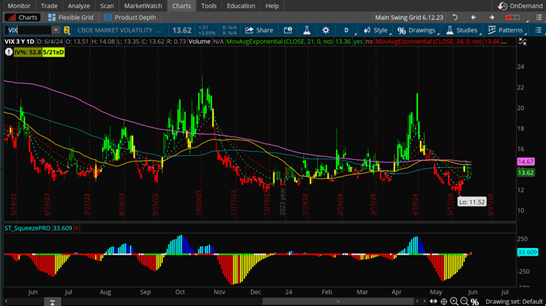
When the VIX sits below 17, it signifies a low-volatility phase. Such periods are ideal for buying the dip, prioritizing stocks showing relative strength, and employing strategies like purchasing calls or selling put credit spreads.
During dip-buying phases, strategies such as selling covered calls, put credit spreads, or iron condors (iron flies) can leverage the summer slowdown and sideways-to-upward movement.
Although lower VIX levels translate to decreased premiums compared to periods above 17, the reduced market movement enhances the likelihood of accurate predictions due to the stability.
One effective means of capitalizing on stagnant markets is by engaging in butterfly trades. Leveraging this strategy allows directional long positions while exploiting premium selling attributes. Profits can still accrue even amidst minimal market fluctuations, thanks to the decay of the center strike on the butterfly.
5 Stocks Our Experts Predict Could Double In the Next Year
By submitting your email, you'll also get a free pivot & flow membership. A free daily market overview. You can unsubscribe at any time.