Editor’s Note: Starting on October 1, we are going to begin publishing Smart Money at 1 p.m. Eastern Time each day to ensure you have our latest analysis midday.
We hope this change helps you to make the most of all the opportunities Wall Street has to offer. Good investing!
Tom Yeung here with today’s Smart Money.
When stock markets hit fresh record highs, investors broadly separate themselves into two groups:
- Bulls: These daring investors see rising markets as a sign of even more gains to come. Time to buy.
- Bears: Others see record-high prices as inviting a correction. Time to sell.
Some of this stems from individual psychology.
We know that people with “internal locus of control” (i.e., a belief that they are in command) typically bet on numbers that have already shown up on a roulette wheel. They’re more trusting in “hot hand” theories, making new market highs a bullish signal.
Meanwhile, those with “external locus of control” (where outside factors like luck, fate, or other people are stronger influences) usually switch their roulette bets to numbers that have not yet shown up. They are more likely to avoid “hot outcome” bets and believe in mean reversion.
Another factor is experience.
Investors who learned their trade during a crash or financial crisis often see high prices as a cue to take profits.
We wrote here recently that older Japanese investors are typically more conservative for that reason. On the other hand, younger investors who began their investment careers after 2009 will have only ever seen “buy-the-dip” strategies pay off.
Regardless, the stock market’s recent highs have divided Americans almost equally down the center. Of people surveyed by the American Association of Individual Investors on September 17…
- 41.7% said they were “bullish” on stocks
- 42.4% said they were “bearish” on stocks
So, who’s right?
I’ll explore this question in today’s Smart Money… and share our course of action for market moves ahead.
What the S&P’s Record Highs Shows Us
To answer the question above, I’ve reviewed S&P 500 data since 1927 and recorded each instance where the U.S. index hit a new all-time high.
To prevent double-counting, record highs within 12 months of another one are ignored.So, if the S&P 500 hit a new record on April 4, and then another one on April 5, only the first date is counted.
That leaves us with 35 instances of new S&P 500 records from the past century. And here’s what the average return looks like over the following two years (roughly 500 trading days).
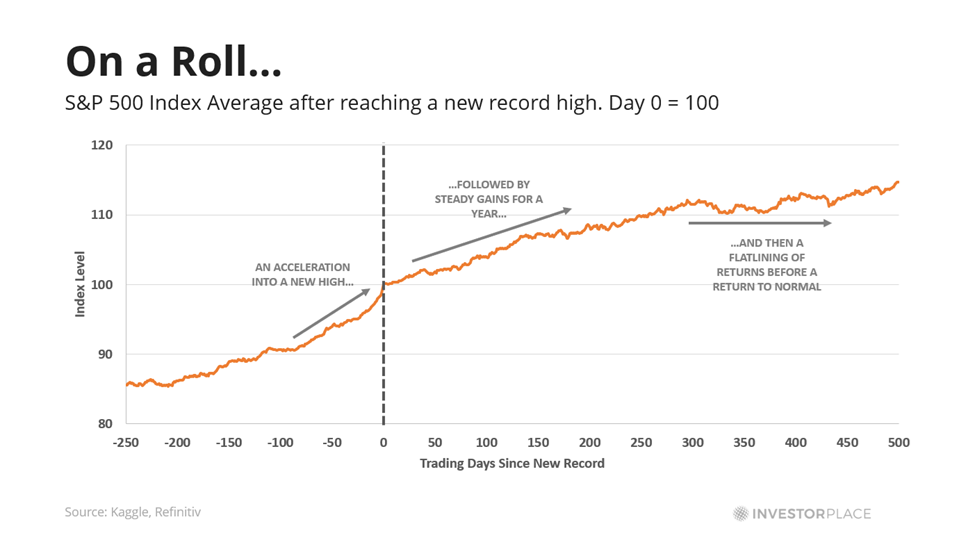
The graph above clearly shows an acceleration into a new record high, followed by a steady one-year return of 9.9% between trading day 0 and 252. Stocks then flatline for a while before returning to normal growth rates.
So, on average, buying at fresh record highs is great for your wallet.
That’s a point for bullish investors.
But we all know that simple averages can hide devastating outcomes.
Below shows the same graph with all 35 times the S&P 500 hit a new record high. You’ll quickly notice that the average 9.9% return now looks almost imperceptible when compared to the wide range of past outcomes.
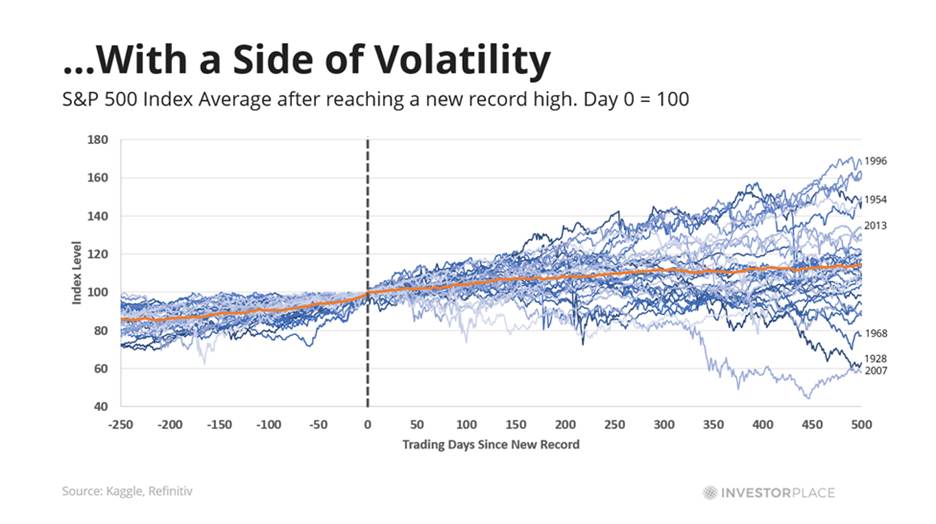
As you can see, there are some beautiful years and some downright ugly ones. That’s one point of bearish investors.
In fact, the size of the market’s ups and downs roughly doubles after new market peaks. So, even though stocks still make money, the extra volatility means that gains aren’t much better once you factor in the additional risk.
This highlights two important facts…
The Tale of Two Cases
1. The Base Case.
During normal times, high share prices usually signal more gains to come.
After all, corporate earnings often have momentum behind them. If profit growth was high last quarter, there’s a good chance they’ll also be great in the next one. These high earnings then power stock prices higher.
2. The Disaster Case.
However, high prices also invite greater risks of collapse.
In fact, the bear market that came after 1928 (the start of the Great Depression) was so long-lasting that it took the S&P 500 another 25 years to regain lost ground.
That’s because high share prices can hide questionable business and poor regulatory decisions.
The 2021 bull market, for instance, allowed dozens of badly run electric vehicle companies to raise billions in cash simply because they had the letters “EV” attached to their investor presentations. Most ended in bankruptcy.
Elevated share prices make the fall ever more painful. As the saying goes, “The bigger they are, the harder they fall.”
This perfectly encapsulates our markets today, where even hints of bad news can send shares spiraling.
So, What’s Next?
Bottom line: We believe that there are still more gains to be had, especially in fast-growing sectors like artificial intelligence.
But rising markets can make it easy for AI companies to fool investors into buying shares. Much like EV stocks in 2021, many so-called “AI” firms will turn out to be duds… or even outright frauds.
This is especially true as AI enters its next frontier, which isn’t happening on your laptop or smartphone screen, or in a chatbot. It’s happening on city streets… in Walmart Inc. (WMT) warehouses… and, very soon, on your doorstep.
It is “Physical AI” – when software intelligence meets the physical world. It’s a world that’s so new that few people truly know which companies will rise tenfold… and which will go to zero.
That’s why Eric, along with InvestorPlace analysts Louis Navellier, Luke Lango, put together the Day Zero Portfolio. This portfolio holds a carefully selected group of companies that are exposed to the next wave of AI exponential progress, giving those with access targeted exposure as well.
Click here to learn more.
Until next week,
Tom Yeung
Market Analyst, InvestorPlace