Baidu Inc BIDU will report its third-quarter earnings on Thursday. Wall Street expects $2.35 in earning per share and $4.69 billion in revenues as the company reports before market hours.
The stock is down 22.24% over the past year, 24.97% year-to-date.
Let’s look at what the charts indicate for Baidu stock and how the stock currently maps against Wall Street estimates.
Read Also: Alibaba Eyes Raising $5 Billion Via Bond Sale to Fund Debt Payoff and Stock Buybacks
Baidu Stock In Strongly Bearish Trend
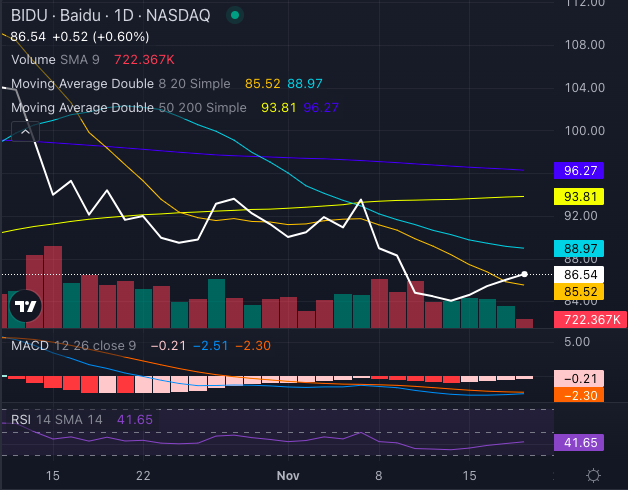
Baidu stock is navigating a strongly bearish trend as its current share price sits below its five, 20 and 50-day exponential moving averages.

Chart created using Benzinga Pro
Despite this, Baidu is experiencing subtle buying pressure, offering a glimmer of bullish potential.
The stock trades just above its eight-day simple moving average (SMA) of $85.52, signaling a short-term bullish outlook. However, longer-term indicators tell a different story: the 20-day SMA at $88.97, 50-day SMA at $93.81 and 200-day SMA at $96.27 all reflect bearish signals.
The MACD indicator of a negative 2.51 underscores the downward momentum, while the RSI of 41.65 suggests the stock is approaching oversold territory, hinting at potential support levels ahead.
Baidu Analysts See 23% Upside
Ratings & Consensus Estimates: The consensus analyst rating on Baidu stock stands at a Buy currently with a price target of $151.95. Recent analyst ratings from Mizuho, HSBC and Susquehanna suggest a 22.99% upside for Baidu stock, with a $106.67 average price target.
Price Action: Baidu stock was trading at $86.52 per share, up 58%, at last check Wednesday.
Read Next:
Image: Shutterstock
Market News and Data brought to you by Benzinga APIs