As a company that has effectively transitioned into a proxy wager for the cryptocurrency market, MicroStrategy Inc. MSTR must take the good with the bad. On the positive side of the spectrum, the returns of MSTR stock during its decisively bullish cycles are nothing short of extraordinary. However, on the negative side, MSTR tends to be incredibly volatile — hardly surprising given that it acts like a crypto alternative.
Largely coinciding with the digital asset ecosystem, MicroStrategy saw its equity value peak late last year. Since then, broader economic, social and geopolitical concerns have weighed on investor sentiment. At the moment, gold bullion — the traditional safe-haven asset — has been the category to watch. Still, with inflation coming in hotter than expected, several leading cryptos enjoyed a sizable pop recently.
While precious metals tend to attract buying demand during inflationary periods, it’s not at all shocking to see blockchain assets absorb some of the safe-haven market share. As data from Bank of America Private Bank revealed last year, millennial investors who have at least $3 million are piling aggressively into cryptos.
As the asset of choice among young people, MicroStrategy stands on solid ground. Interestingly, amid the optimistic fundamental backdrop, MSTR stock appears to be charting a buy signal. Specifically, a triangular shape has formed, reminiscent of a bullish pennant formation.
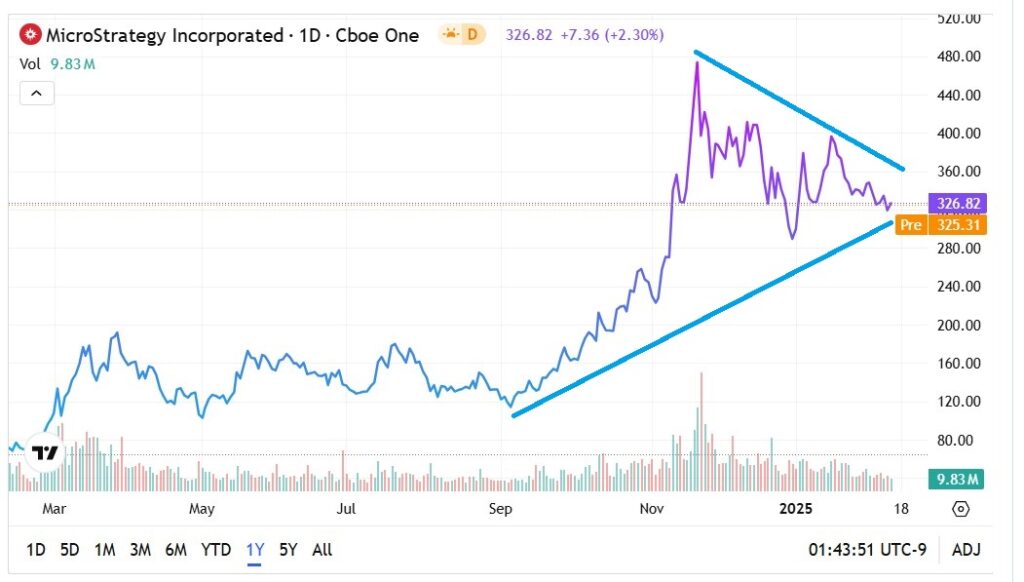
Granted, standard technical analysis is interpretive, which naturally generates skepticism. However, the empirical framework also supports the bullish angle, making MSTR stock a tempting (albeit high-risk) proposition.
Playing MSTR Stock by the Numbers
One of the benefits of investing in a relatively saccharine investment like the SPDR S&P 500 ETF Trust SPY is that investors can bank on the upward bias of the benchmark equities index. What may catch some folks off guard is that MSTR stock likewise leans northward, at least when considering the parameters of the trailing five years.
From a stochastic or temporal view of the data, a position in MSTR entered at the beginning of the week has about a 53.2% chance of rising by the end of it. Over the course of a four-week period, the long odds actually inch forward at 53.82%. Place enough bets and theoretically, speculators should noticeably win more than they lose.
Circumstances get even more intriguing when considering dynamic probabilities — probabilities based on certain conditions being true. The best way to think about this is the difference between a baseball player’s batting average over a season (stochastic) versus that player’s batting average when runners are in scoring position (dynamic).
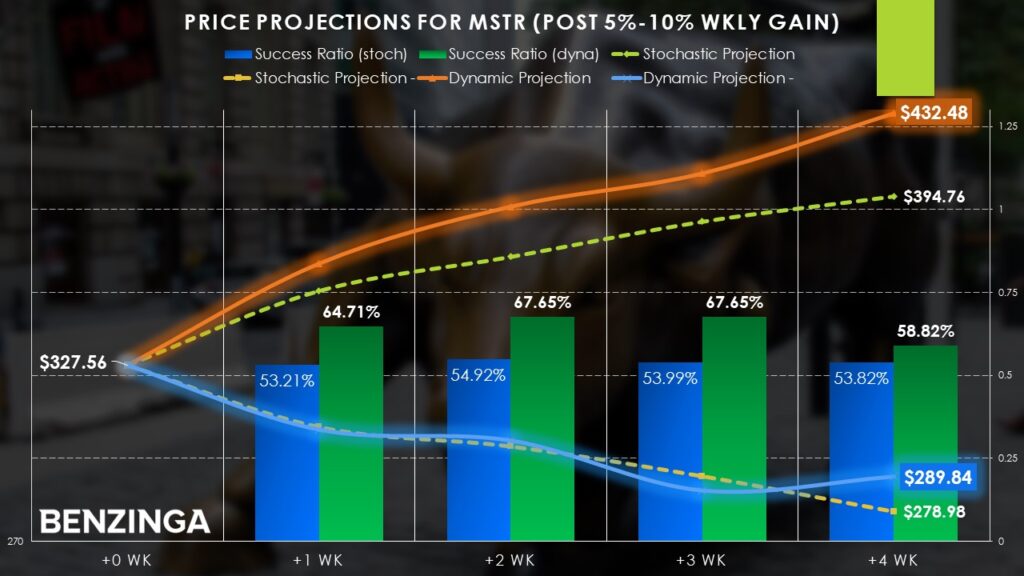
For example, last week, MSTR stock gained roughly 5.7%. Whenever MSTR gains between 5% and 10% in a one-week period, the subsequent week enjoys long odds of 64.71%. This metric improves to 67.7% through the end of the third week and ultimately slips to 58.82% by the end of the fourth week. Still, the evidence seems clear: modest (at least for MSTR stock) strength fuels FOMO or the fear of missing out.
Recall that FOMO is a powerful emotion. Earlier, I identified Palantir Technologies Inc. PLTR as a FOMO stock, despite already enjoying remarkable upside. As of this writing, PLTR continues to march higher. I also said the same thing about Robinhood Markets Inc. HOOD before its big earnings blowout.
Also Read: 5 Robinhood Analysts React To ‘Blowout’ Q4 Earnings: Can The ‘Tremendous Momentum’ Continue?
A Risky but Rare Opportunity
From a holistic perspective, MSTR stock — while being wildly risky on account of being a crypto proxy — is simultaneously enticing. It’s a rare opportunity, combining compelling fundamental, technical and statistical catalysts. While a volatility play could be prudent, the evidence seems to lean heavily toward the northbound direction.
The magnitude of bullishness, though, is the question. Under the previously calculated dynamic odds, over a four-week period, the median return under the positive scenario stands at an astounding 32%. Under the negative scenario, the median loss sits at 11.5%.
Based on the implications of the bullish pennant formation, it’s not impossible to see a 30%-plus breakout move. However, arguably most investors might find that to be too much of a stretch. On the other hand, a 10% move within a few weeks should be quite reasonable.
One idea to consider, then, is the 355/360 bull call spread for the options chain expiring March 7. This transaction involves buying the $355 call and simultaneously selling the $360 call. Speculators are aiming for MSTR stock to reach $360 or above, triggering the maximum reward.
To be clear, a bull spread caps the risk and the reward. However, one of the benefits of this multi-leg options strategy is that the sale of the short call helps offset the debit paid for the long call, effectively discounting the net bullish position.
Plus, with a debit paid at time of writing of $210 (which is the most that can be lost in the trade) for the chance to earn $290, the positional risk is manageable. More importantly, the data implies that the probabilistic risk is more reasonable than meets the eye.
Read Next:
Photo: Shutterstock
© 2025 Benzinga.com. Benzinga does not provide investment advice. All rights reserved.