CVS Health Corp. CVS is flashing a bullish signal as it completes a Golden Cross — an event where the 50-day simple moving average (SMA) rises above the 200-day SMA.
With the stock up over 51% year to date and continuing to trade above key moving averages, technicals suggest further upside.
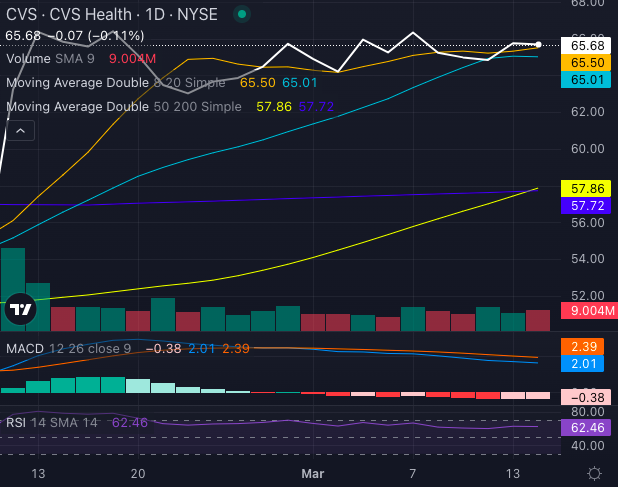
Chart created using Benzinga Pro
Adding to investor enthusiasm, CVS’s weight management program has delivered an average 15% weight loss for participants while cutting costs by 26%.
Read Also: Allegations of Inflated Prescription Drug Costs Spark Employee Lawsuit Against JPMorgan
CVS Stock Technicals Point To Strength
Several technical signals confirm CVS stock’s strong uptrend:
- Golden Cross Formation: The 50-day SMA ($57.86) has officially crossed above the 200-day SMA ($57.72), reinforcing a bullish outlook.
- Momentum Stays Strong: CVS stock trades above its eight-day, 20-day and 50-day SMAs, confirming sustained buying pressure.
- Moving Average Covergence/Divergence (MACD) Indicator: At 2.01, the MACD remains in bullish territory, signaling strong upward momentum.
- Relative Strength Index (RSI): The RSI at 62.46, is nearing overbought territory, indicating that CVS stock remains in a strong trend, though some profit-taking could occur.
CVS Weight Loss Program Gains Traction
On the fundamental side, CVS reported that its Weight Management program led to an average 15% weight loss among participants and a 26% reduction in weight-loss drug costs. The program, which integrates GLP-1 medications with personalized nutrition plans, has been rolled out to 3.5 million members.
CVS stock has been riding this wave of positive news and strong technicals. The golden cross suggests continued bullish momentum, though with RSI creeping higher, short-term volatility could emerge. If buying pressure remains, CVS could see further gains in the coming weeks.
Related:
Image: Shutterstock
Momentum49.49
Growth75.79
Quality15.94
Value40.39
Market News and Data brought to you by Benzinga APIs