Delta Air Lines Inc DAL isn’t just taking its customers to new destinations — it’s flying high on the stock charts as well.

Chart created using Benzinga Pro
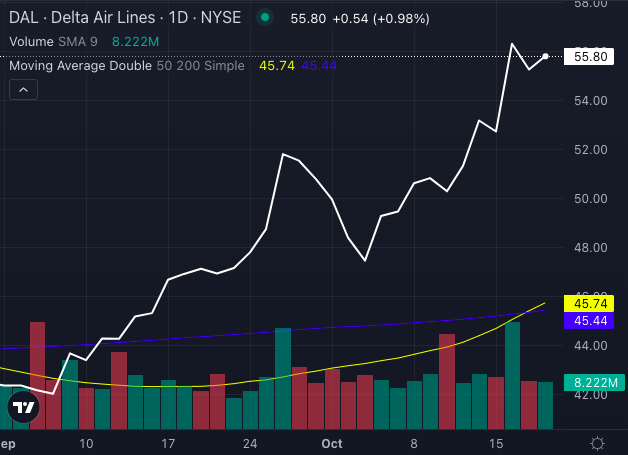
The airline, nearing its 100th anniversary, is basking in a Golden Cross — a bullish signal where the 50-day moving average crosses above the 200-day, suggesting that the skies ahead may be clear for takeoff.
Delta Air Lines’ Stock Chart Indicating Upward Trends
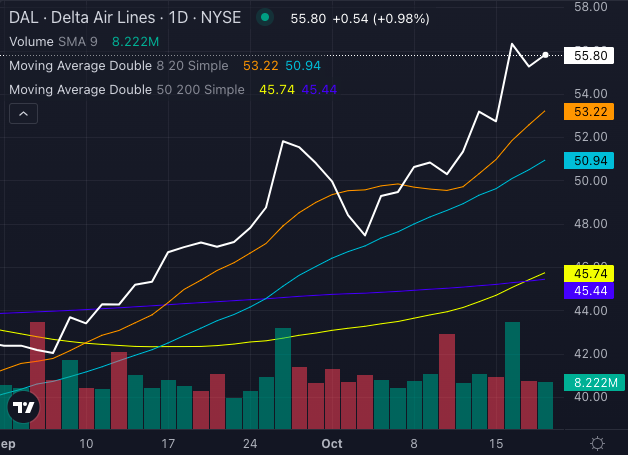
Trading at around $55 a share, Delta is currently soaring above its five, 20, and 50-day exponential moving averages, signaling strong buying pressure.

Chart created using Benzinga Pro
With the eight-day SMA at $53.22 and 20-day SMA at $50.94, Delta Air Lines’ stock is on a bullish trajectory, comfortably cruising above key levels. Even the 200-day SMA sits at a distant $45.44, making the stock appear undervalued.

Chart created using Benzinga Pro
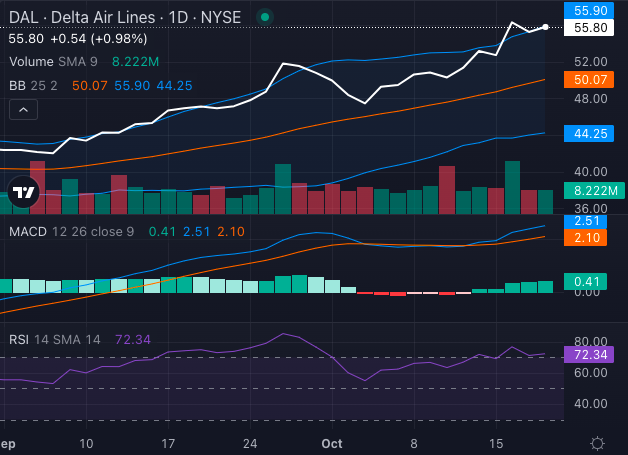
The MACD indicator shows optimism, with a value of 2.51, reflecting a strong bullish trend. However, the RSI at 72.34 suggests the stock is overbought, hinting at a potential pullback in the near future despite the current bullish sentiment.
The Bollinger Bands, ranging from $44.25 to $55.90, indicate that Delta’s stock has broken above crucial resistance levels, strengthening the case for further gains.
Read Also: $1000 Invested In Delta Air Lines 15 Years Ago Would Be Worth This Much Today
Delta’s Newly Designed Cabins Elevate Passenger Experience
Beyond the financial numbers, Delta is unveiling its updated cabin interiors, starting with its Boeing 757s in the upcoming months.
Featuring premium materials and residential-style lighting, the airline is merging comfort with elegance, redefining the in-flight journey for passengers.
Yet, as the airline undergoes this transformation, investors wonder if Delta’s stock will continue its positive trajectory or pause for a brief respite.
For now, Delta is riding high, both in the skies and on the stock market, showcasing its commitment to excellence in all dimensions of its operations.
Read Next:
Image: Shutterstock