The are currently trading at 6,479.00, showing signs of stabilization after testing a low of 6,371.75 earlier in the week. This level coincided with a key VC PMI support cluster near the Buy 1 Weekly (6,300) zone, which has acted as an anchor for the recent rebound. From a structural standpoint, the market is now pivoting around the VC PMI Daily mean of 6,489, suggesting a balance point between supply and demand.
The VC PMI framework highlights a clear trading roadmap. On the downside, the Buy 1 Weekly (6,300) and Buy 2 Weekly (6,128) levels define the critical demand zone, where probabilities favor long entries with 90–95% mean-reversion potential. On the upside, the Sell 1 Weekly (6,584) and Sell 2 Weekly (6,696) levels mark the zones of distribution and high probability for profit-taking. Currently, price is oscillating between the Daily Buy 1 (6,454) and Daily Sell 1 (6,552) pivots, consolidating just beneath the weekly resistance band.

From a Gann cycle perspective, the market appears to be transitioning from a short-term trough. The 30-day cycle, anchored from the July 30th low at 6,276, projected a crest into the August 27–29 window. This cycle projection aligned with the recent high at 6,523, where price met resistance near the Daily Sell 1 pivot. The corrective phase into August 31–September 2 marks the anticipated trough window, with the rebound from 6,371 confirming this cycle low. The next 30-day crest projects into the September 27–29 timeframe, aligning with the potential retest of the 6,584–6,696 resistance band.
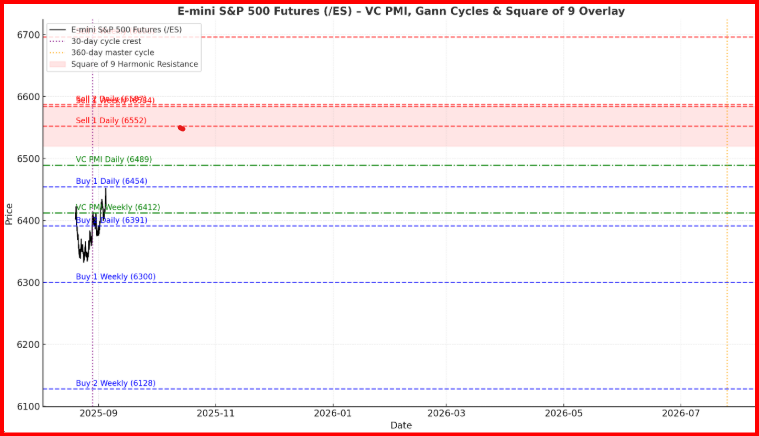
The Square of 9 price harmonics reinforce these levels. The 6,276 pivot low maps to a 180° harmonic resistance around 6,552–6,584, precisely where the current rally is encountering overhead pressure. A full 360° cycle extension from this pivot targets 6,696–6,720, harmonizing with the Sell 2 Weekly level, further validating this zone as a critical time/price convergence.
Momentum indicators, particularly the MACD, show signs of basing after prolonged downside pressure, suggesting that the market may have completed its short-term correction. However, a sustained breakout above 6,584 is required to confirm bullish continuation toward 6,696 and beyond. Failure to hold the 6,454–6,489 balance zone risks a retest of the 6,300 support cluster.
***
TRADING DERIVATIVES, FINANCIAL INSTRUMENTS AND PRECIOUS METALS INVOLVES SIGNIFICANT RISK OF LOSS AND IS NOT SUITABLE FOR EVERYONE. PAST PERFORMANCE IS NOT NECESSARILY INDICATIVE OF FUTURE RESULTS.