Understanding Market Psychology
When it comes to investing, the common adage of “buy low, sell high” can be a perilous pitfall for the average investor. In over two decades amidst the hustle and bustle of Wall Street, it has become clear that chasing peaks and valleys is a strategy doomed for disappointment. Instead, the key to success lies in seizing reactionary pullbacks within a prevailing bull market. While the allure of a discounted deal is strong, the true gems lie in purchasing during market retreats within an upward trajectory. This strategic move is especially pertinent given the fickle nature of the market, an ever-changing landscape where sentiment can turn at a moment’s notice.
The central premise behind this investing philosophy is to trade against a level. When the market dips to a crucial indicator like the 50-day moving average, investors can prudently manage risk levels. This approach avoids the dangerous temptation of chasing after stocks that shoot up rapidly, as such meteoric rises often precede a sharp decline when eager sellers swoop in.
In the realm of strong bull markets, even a minor downturn can trigger a significant shift in investor sentiment. The key to navigating this rollercoaster ride on Wall Street is to zig when others zag, fading the crowd and capitalizing on the undercurrents in the market.
Five compelling indicators suggest a potential bounce in the S&P 500 Index ETF (SPY) and major U.S. indices. These include:
Anticipated Earnings Per Share (EPS) & Shorts Covering
With earnings season looming, tech titan Netflix (NFLX) is set to kick things off. Historically, stocks rally in the lead-up to earnings announcements in bullish environments. In parallel, short sellers tend to close their bearish positions before these pivotal events to evade potential losses.
Support Levels of Market Leaders
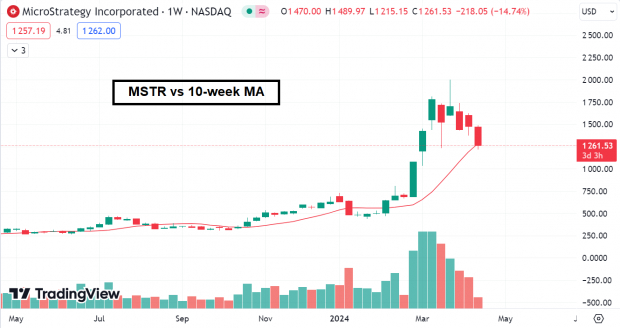
The trajectory of prominent players such as Super Micro Computer (SMCI), Nvidia (NVDA), and Coinbase (COIN) is telling. These industry stalwarts are currently retracing to their 10-week moving averages after a prolonged ascent. Historically, this zone has acted as a springboard for renewed buying interest.

Image Source: TradingView
Waning Investor Confidence
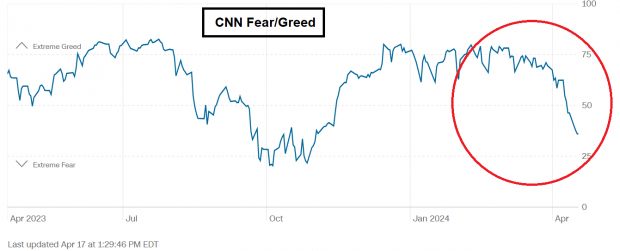
Despite only a modest descent in equities, market sentiment has taken a nosedive. The S&P 500 stands a mere 5% off its peak, yet the prevailing sentiment has shifted from exuberance to apprehension. It is worth recalling that in the world of bullish markets, the greatest opportunities often arise amidst the cacophony of doubt.

Image Source: CNN
Gap Fill and Retest of Breakout Zones
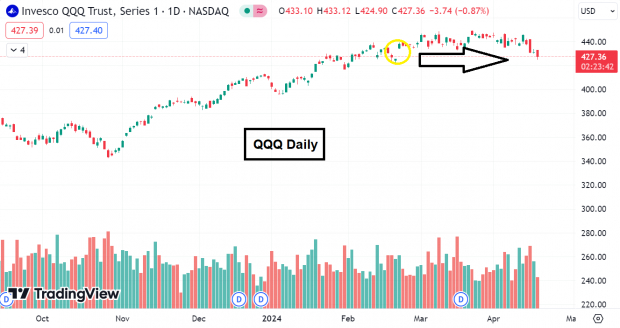
A recent reunion with an open gap in the QQQ index serves as a poignant reminder. These gap fills often mark pivotal turning points, morphing into robust support levels.

Image Source: TradingView
Seasonal Patterns at Play
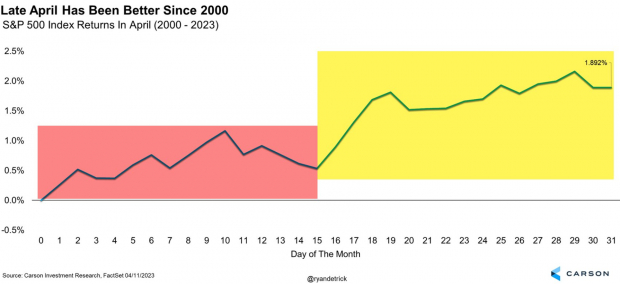
Delving into historical seasonal trends since the turn of the millennium, statistics lean favorably towards bulls in the latter half of April. This recurrent pattern could sway the market sentiment positively.

Image Source: Ryan Detrick, Carson Research
In Conclusion
While recent market uncertainties have rattled the nerves of many investors, five compelling signs hint at a potential ripe moment for savvy market participants to seize upon.