Navigating September’s Historical Volatility Amid Ongoing Economic Tides
Looking back over the years, September has a habit of turning choppy.
In the past 95 years, the S&P showed gains in September 42 times. However, in the remaining 53 losing years, the S&P experienced an average decline of 4.7%.
The recent memory lane had its share of rough Septembers:
- 2021: -4.8%
- 2022: -9.3%
- 2023: -4.9%
These numbers prepare us for potential volatility without needing to panic. As history has shown, while September and sometimes October can be painful, the months that follow, particularly November and December, often bring impressive returns.
Beyond Seasonal Trends: A Deeper Dive into Current Market Dynamics
Assessing the current landscape presents unique challenges.
On one side, if stocks retreat this month, as historical data suggests on occasion, it might merely follow a familiar pattern.
On the flip side, the present market/economic climate is far from ordinary.
We find ourselves at record or extreme levels across various indicators and market characteristics – a sign that while gains may continue, instability remains a prevailing concern.
Should the stocks start to slide, distinguishing between temporary seasonal weakness and something more ominous poses a critical question.
Before delving into that, let’s explore some of these signs of “instability” to provide context for our current position.
Approaching Record Highs in Household Stock Allocation
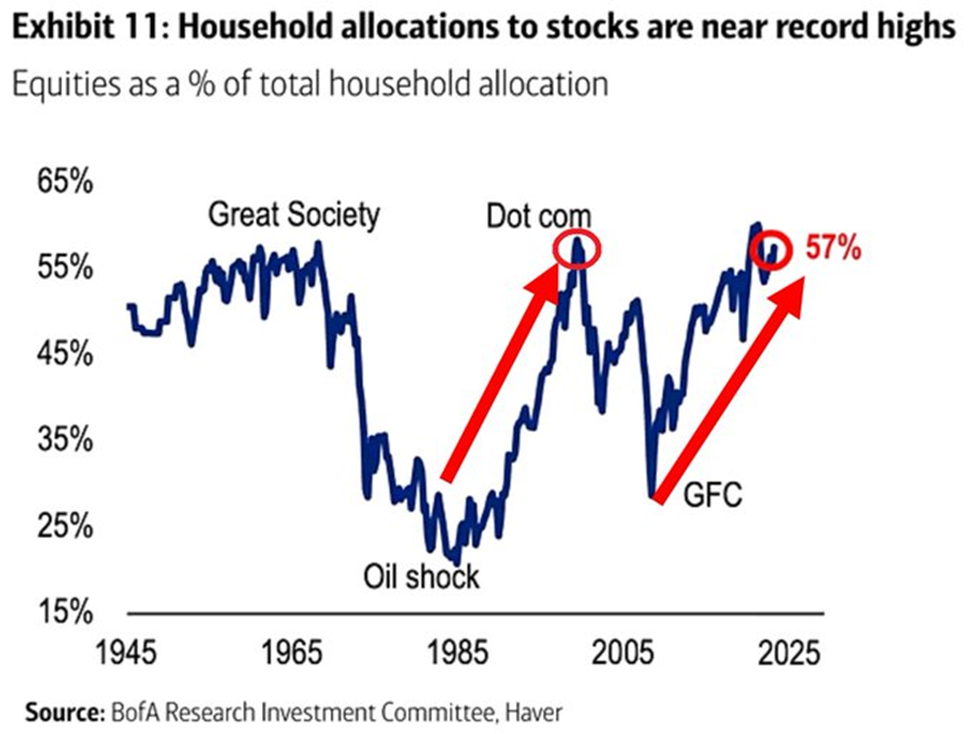
Reports from Global Markets Investor reveal that the US household allocation to stocks recently climbed to 57%, approaching near-record levels.

Source: BofA / Global Markets Investor
This percentage has more than doubled in ~15 years and is now reminiscent of the 2000 Dot-Com Bubble Peak.
As highlighted in previous insights, an excessive stock allocation by households often acts as a red flag. When a large number of individuals already hold stocks, there are fewer potential buyers available to sustain upward price pressure.
Quoted from Stéphane Renevier of Finimize:
Several factors sway short-term stock returns: interest rates, economic indicators, geopolitical challenges, investor sentiment – even weather conditions.
However, over the long haul, one factor prevails above all: the proportion of assets individuals invest in stocks.
This ratio consistently serves as a reliable predictor of stock returns over a ten-year span, overshadowing heavyweight elements such as valuations.
It underscores that when investors heavily favor stocks, their long-term gains typically fall below average…
While the percentage of American stockholders may keep climbing, statistically, the odds aren’t in favor. We will circle back to this shortly.
Amidst Market Concentration: Exceeding the Dot-Com Bubble’s Reach
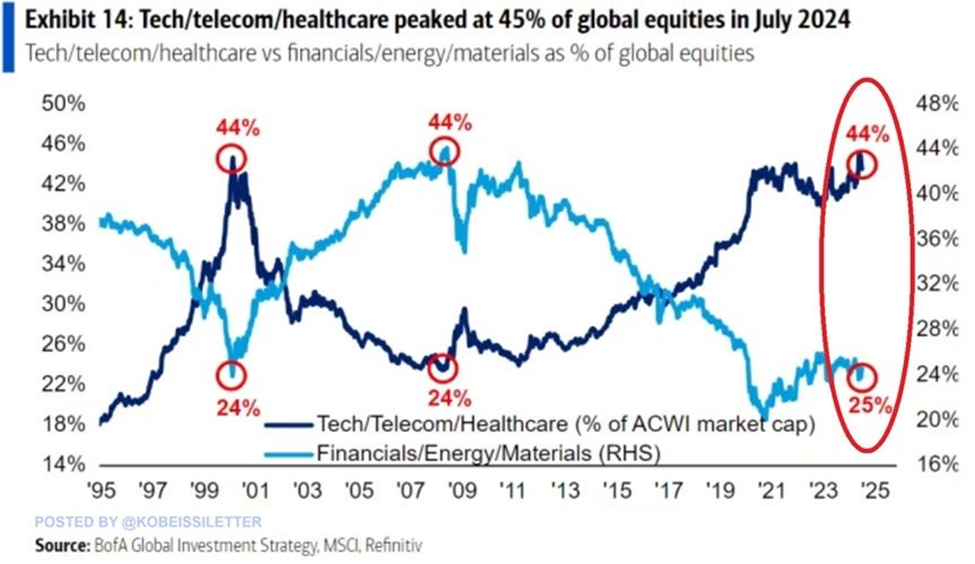
Recent data from The Kobeissi Letter specifies that the combined weight of the technology, telecom, and healthcare sectors in the global stock market hit a historic high of 45% in July 2024.
Over the past four years, this percentage has surged by approximately 10 points. The current 45% figure surpasses the prior record of 44% achieved in 2000, during the peak of the Dot-Com bubble.
Conversely, the weight of the financial, energy, and materials sectors relative to global stocks has dwindled to 25%, nearing the 2000 level of 24%.

Source: The Kobeissi Letter, BofA
While not indicative of an impending market crash, this trend does flag heightened market turbulence.
In Housing: Testing Price Peaks with Inflation-Adjusted Highs
Nick Gerli, CEO of Re:venture Consulting, remarks that inflation-adjusted home prices have climbed to nearly twice their 130-year average.
Here’s a glimpse of the current scenario:
Unveiling the Reality Behind the Housing Dilemma
The Unsettling Trajectory of the Housing Market
As we ponder the current state of the housing market, Nick Gerli’s alarming words ring in our ears: “We are in the biggest housing bubble of all time…” Indeed, the figures speak for themselves; inflation-adjusted home prices now loom nearly double their 130-year average.
The Historical Context: A Glimpse into the Past
A brief glance through the annals of history showcases that such a phenomenon has only occurred twice in American history: in 2006 and the present moment. This repetition should evoke a sense of unease among investors as we navigate uncharted waters.
Shedding Light on the Economic Disparity
One metric that sheds light on this troubling reality is the comparison between home price appreciation and real income growth. A healthy economy would witness a fairly balanced ratio, if not one leaning towards real incomes outpacing home prices. However, the opposite holds true today. Since 1970, real home prices have surged by an astounding 102%, starkly contrasting with the mere 26% increase in real incomes.
Challenging the Notion of a Bubble
Contrary to Gerli’s dire warning of an impending burst, an alternate viewpoint emerges. It would be logical to label the current scenario a “bubble” only if an identical amount of funds from years past had flooded into the housing sector. Yet, that is not the case.
The Role of Government Intervention
Recall the surge of freshly minted cash injected into the economy by the government during the height of the pandemic. A considerable portion of this influx found its way into the housing realm, leading to a one-time elevation in prices.
An Economic Symphony: The Interplay of Money Supply and Prices
An analysis of the M2 Money Supply offers a visual representation of this economic symphony. The surge in the M2 Money Supply post-pandemic, trailing the Median Sales Price of Houses Sold by approximately a year, delineates a clear correlation.
A New Normal on the Horizon?
In light of this, the notion of an impending housing crash loses its vigor. With this influx firmly integrated into our economic framework, a significant deflationary recession seems the only force capable of altering this trajectory.
The Socioeconomic Ramifications
The Evolving Gap Between the Affluent and the Struggling
The ever-widening chasm between the “haves” and “have nots” manifests starkly in the realm of homeownership. The resurgence of the stock market has propelled the number of 401(k) millionaires to an all-time high.
The Tale of Two Economies
While the fortunes of the affluent continue to scale unprecedented heights, financial turmoil intensifies for the less fortunate. The stark contrast between the two economic classes echoes the broader economic tumult plaguing our society.
The Current Financial Landscape: A Closer Look at Debt, Savings, and Stock Market Speculation
The Balancing Act of Finances
Credit card debt has surged to unprecedented levels, concurrent with a historic low in the savings rate, indicating a precarious financial equilibrium. The visualization from ZeroHedge asserts this reality starkly, emphasizing the growing debt burden and declining propensity for saving.
Retirement Realities
In stark contrast to the surge in 401(k) millionaires, studies reveal a concerning lack of preparedness for retirement among the general populace. With an average 401(k) balance barely surpassing $127,000, the prospect of accumulating the deemed necessary $1.5 million for a comfortable retirement looms as a daunting challenge for many.
Data from Prudential Financial paints a grim picture, with only a fraction of individuals approaching retirement age having sufficient savings. Similarly, a study on Gen X’s retirement readiness exposes a pervasive belief that retiring is akin to a miracle, indicating a widespread sentiment of inadequacy for the golden years.
The profound discrepancy in retirement readiness between different socioeconomic strata is accentuated by retirement expert Teresa Ghilarducci, illustrating the diverging retirement durations experienced by the affluent and the less privileged, creating a stark contrast in post-working life quality.
Stock Market Speculation and Diverging Fortunes
Despite the record stock ownership levels, a growing disenchantment among the populace, as exemplified by viral memes, portrays the struggle of working multiple jobs just to make ends meet. This disparity questions the sustainability of stock market growth, with doubts arising on who will continue propelling prices upwards.
Furthermore, as global governments accumulate historic debt and central banks stockpile gold, the financial infrastructure braces for potential upheavals. The recent yield curve inversion acts as an ominous prelude to a brewing economic downturn, triggering concerns among investors and analysts alike.
Navigating a Turbulent Market
Amidst the fervor of a bullish stock market, undercurrents of instability underline the need for careful evaluation of investment portfolios. Distinguishing high-conviction holdings from speculative ventures becomes paramount in safeguarding wealth amid potential market volatilities.
This strategic approach aims to reinforce the rationale behind core investments while establishing clear exit strategies for speculative positions, ensuring financial resilience in the face of uncertainty and market fluctuations.
As market conditions fluctuate and investor sentiment wavers, maintaining a prudent stance and implementing protective measures can shield investors from the fallout of market turbulence, preserving their long-term investment objectives.
Conclusion
The evolving financial landscape demands vigilance and foresight from investors as they navigate through economic uncertainties and market fluctuations. By blending astute analysis with strategic risk management, individuals can fortify their investment portfolios against the prevailing volatility, safeguarding their financial well-being in the process.