Meta Platforms Inc META will report third-quarter earnings on Wednesday, Oct. 30. Wall Street expects $5.24 in EPS and $40.27 billion in revenues as the company reports after market hours.
Meta stock is up 94.9% over the past year, 70.35% year-to-date.
Let’s look at what the charts indicate for Meta stock and how the stock currently maps against Wall Street estimates.
Read Also: Retail Investors Betting Money On A Trump Win, Meta To Challenge Google Search Dominance
Meta Stock Chart Bullish Ahead Of Q3 Earnings
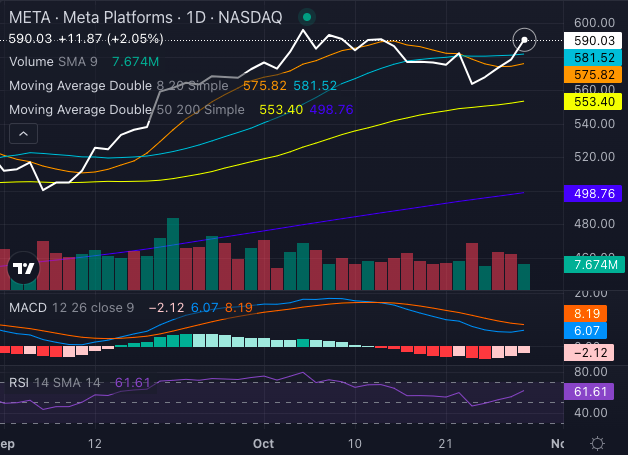
Meta stock displays a primarily bullish technical outlook, suggesting potential gains for investors despite minor short-term challenges.

Chart created using Benzinga Pro
Trading above its five, 50 and 200-day exponential moving averages, Meta’s price of $590.03 points to solid buying interest and an overall bullish trend.
The share price remains above the eight-day simple moving average (SMA) at $575.82, the 20-day SMA at $581.52, hinting at solid short-term momentum.
Moreover, the stock’s strength above the 50-day SMA of $553.40 and well above the 200-day SMA of $498.76 signals positive momentum, especially for long-term investors.
The MACD at 6.07 supports this bullish stance, and with the rising RSI at 61.61 hovering near overbought levels, investors should monitor for any near-term pullbacks as possible buying opportunities within an overall upward trend.
Meta Analysts See Over 14% Upside
Ratings & Consensus Estimates: The consensus analyst rating on Meta stock stands at a Buy currently with a price target of $620.05. The latest analyst ratings from Bernstein, Jefferies and TD Cowen in October, suggest a 14.32% upside for Meta stock, with an average price target of $675.
Price Action: Meta stock was trading at $590.32 at the time of publication.
Read Next:
Image: Unsplash
Market News and Data brought to you by Benzinga APIs