Although chip supply specialist ON Semiconductor Corp ON benefited handsomely from the wider surge in innovation, an enterprise can’t take the good without the bad. Recent weakness in the tech ecosystem took down several names and ON stock was no exception. In the business week ending Jan. 10, the equity slipped 16.22%.
Adding to skepticism beyond the overall crimson tide in the innovation arena are concerns or headwinds specific to ON stock. In December, a major insider at the company disclosed the sale of 28,000 shares for a total transaction value of nearly $1.92 million. While insider sells don’t necessarily spell doom, it can be a distraction, particularly if the underlying security previously posted robust returns.
Earlier this month, ON stock attracted the attention of technical analysts but for dubious reasons. Several days ago, ON struggled to stay above the $58 support line, leading to concerns that a new downtrend may materialize. So far, the warning has proven prescient.
Despite the troubles, it also cannot be denied that over the past five years, ON stock has enjoyed an upward bias. On any given four-week period, the chances that an investor will see a positive return stands at 57.2%. Therefore, the odds favor bullish speculation — but with one big catch that traders shouldn’t ignore.
Also Read: Broadcom’s $3 Billion Bet: Balancing Market Signals, AI-Driven Growth
ON Stock Features Rebound Potential with a Twist
Generally speaking, market makers deploy stochastic pricing models to estimate high-low price ranges for risk management purposes. Theoretically, the total premium of an at-the-money straddle (buying a put and call at the same strike price) should feature low enough probabilistic risk to entice speculation, but high enough positional risk that the risk underwriting is reliably and consistently profitable over the long run.
Without getting into the mathematical weeds, stochastic models are the equivalent of a baseball player’s batting average over an entire season. Such stats provide general intelligence. However, so-called clutch players often see their batting average rise in leveraged situations, such as runners in scoring position. Similarly, an investor can calculate probabilities based on the materialization of aberrant events.
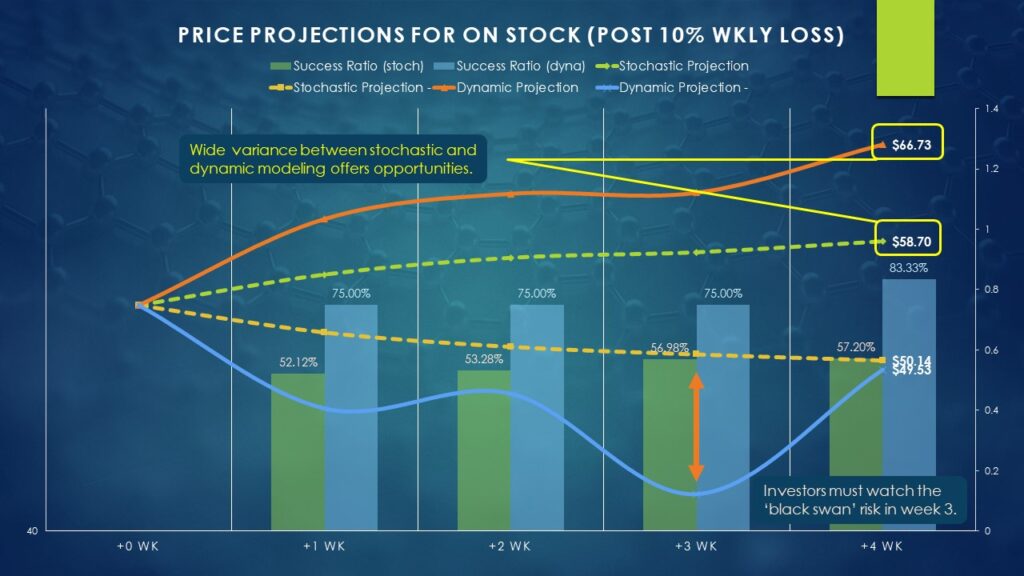
Certainly, what happened last week was aberrant. In the past five years, there have only been 12 weeks (not including last week) where ON stock lost 10% or more. Of this tally, by the end of the fourth subsequent week, ON stood in positive territory 10 times or a bullish success ratio of 83.33%. During these positive responses, the median return clocks in at 23.71%.

On paper, this backdrop seems to favor bullish speculation. However, the twist is that by the end of the third week following a 10% weekly loss or worse, the bullish success ratio is down slightly to 75%. What’s more, on the off chance that ON stock loses value, the median loss sits at a whopping 22.12%.
For whatever reason, the bulls tend not to buy the discount in ON stock in full force until after the conclusion of the third week following a major downturn.
Nuanced Trades to Consider
Given the above framework, there are two ways to tackle ON stock. The first is the most aggressive approach, which is to trade shares this week and the next, with the view of avoiding the third week. By the end of the second week following the 16.22% loss (which corresponds with the options chain expiring Jan. 24), ON could potentially rise by a median rate of 15.91%.
Assuming statistical trends play out predictably, ON stock may reach a peak price of $62.52. Depending on individual risk profile, one could potentially buy a bull call spread with the short (second) leg corresponding with the $62 price target. Using a stochastic method, market makers are mostly underwriting the risk that ON may peak at around $57.
This is why the call spreads with $62 short strikes feature gargantuan payouts — market makers simply aren’t expecting this move.
For the more conservative trader, it may be prudent to wait until after the third week has passed. Waiting doesn’t guarantee anything but it provides more breadth for lingering anxieties to be filtered out of the system.
The end of the fourth week aligns with the options chain expiring Feb. 7. By then, ON stock may reach $58.70 (using stochastic modeling), up to a peak value of $66.73 (using dynamic modeling). Even if traders opted to meet roughly in the middle with a short strike price of $62, the payouts are still generous, again, because the market makers are not expecting such a robust move.
Read Next:
Photo: asharkyu/Shutterstock.com
© 2025 Benzinga.com. Benzinga does not provide investment advice. All rights reserved.