Tesla Inc TSLA is having a rough ride in 2025, and the numbers don’t lie. Among the Magnificent Seven, Tesla is the worst-performing stock year to date, down a staggering 25.66%.
No other MAG 7 stock comes close to that level of decline—Microsoft Corp MSFT, Amazon.com Inc AMZN and Apple Inc AAPL are all down single digits, while Nvidia Corp NVDA and Alphabet Inc GOOGL GOOG have also suffered, but nowhere near Tesla’s slump.
The Lone Laggard Among Magnificent Seven Stocks
The electric vehicle giant is the only stock in the elite group that has dropped over 30% in just the past month. Even over the last five days, Tesla is down over 20%, while the rest of the magnificent seven stocks have seen far milder declines.
Meanwhile, Nvidia, the AI darling, remains the best performer over the past year, up 55%, compared to Tesla’s 40% gain.
Read Also: Tesla Stock Has Fallen Nearly 40% From December Peak, Wiping Almost $137 Billion From Elon Musk’s Wealth
Tesla – A Valuation Outlier
Tesla’s forward P/E ratio of 95.24 (per Benzinga Pro data) is sky-high compared to the rest of the MAG 7, with the second-highest being Apple at 32.26. Nvidia, the poster child of premium valuations, still trades at a much lower 28.09 forward P/E.
Tesla’s trailing P/E is even more extreme at 138.21, suggesting investors are still pricing in significant future growth despite the stock’s pullback.
Revenue Growth & Market Cap Woes
Tesla’s forward revenue growth of 11.44% is solid but lags behind Nvidia’s explosive 59.26% and Meta’s 16.69%, per Seeking Alpha data.
While Tesla still commands a massive market cap of $894.84 billion, it’s a far cry from its trillion-dollar days, trailing well behind Apple, Nvidia, and Microsoft, each sitting above $2.9 trillion.
TSLA Stock Flashes Bearish Signals
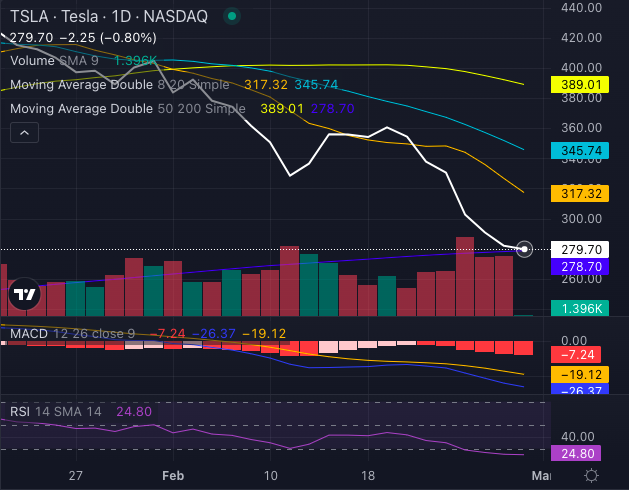
Chart created using Benzinga Pro
TSLA stock, at $279.70, is trading below its five-day, 20-day and 50-day exponential moving averages, signaling strong bearish momentum and persistent selling pressure. The eight-day simple moving average (SMA) sits at $317.32, while the 20-day SMA is at $345.74—both indicating further downside risk.
Additionally, TSLA stock’s 50-day SMA of $389.01 reinforces the bearish sentiment. However, the one silver lining is the 200-day SMA at $278.70, which is right below the current price, offering a potential long-term support level.
The Road Ahead
Tesla’s fundamentals show a company still growing, but at a time when the AI boom is dominating market narratives, EV demand concerns and margin pressures seem to be weighing on sentiment.
With key technical indicators suggesting continued weakness, the question now: is Tesla’s recent freefall an overreaction or a sign of deeper trouble?
Investors will decide—but for now, it’s the only MAG 7 stock firmly in the red for 2025.
Read Next:
Photo: Shutterstock
Market News and Data brought to you by Benzinga APIs