Rivian Automotive Inc RIVN is set to announce its second-quarter earnings after the closing bell on Tuesday.
Analysts forecast a loss of $1.22 per share and revenues of $999.8 million.
Reflecting on recent trends, Rivian’s stock has plummeted by 43% over the past year and is down 37% year-to-date.
Interpreting Rivian’s Technical Signals
The technical analysis of Rivian’s stock unveils a landscape of mixed signals, with hints of both optimism and caution.

Chart created using Benzinga Pro
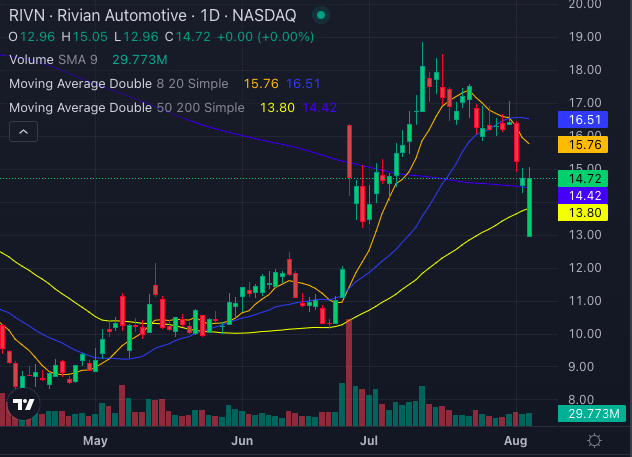
Currently priced at $14.72, the stock sits below its 8-day ($15.76) and 20-day SMAs ($16.51), indicating a bearish trend in the short term.
However, considering longer-term moving averages, the 50-day SMA at $13.80 and the 200-day SMA at $14.42 lie beneath the current price, painting a bullish picture.

Chart created using Benzinga Pro
The stock is currently trading at $14.77, marking a potential turning point.
Analysts’ Insight: Forecasting 20% Growth
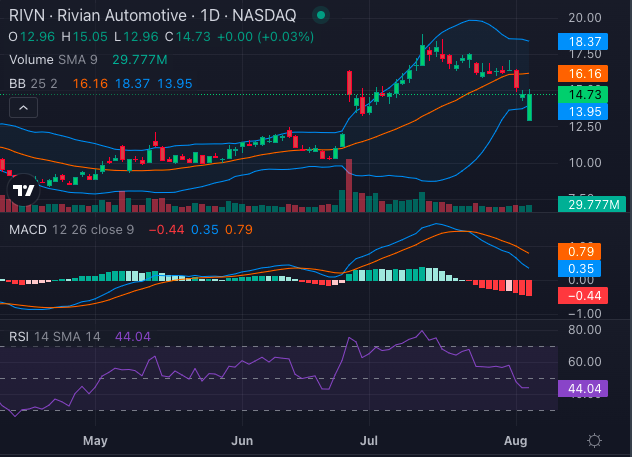
The Moving Average Convergence Divergence (MACD) at 0.35 hints at an upward momentum, while the Relative Strength Index (RSI) at 44.04 trends towards the oversold territory, offering a promising entry point to investors.
The Bollinger Bands (25) positioning, ranging from $13.95 to $18.37, suggests an undervalued status for the stock, potentially signaling a bullish upturn.
With a melody of bullish and bearish indicators, Rivian’s stock journey navigates an intricate path, awaiting a decisive shift.
Rivian Ratings & Consensus Estimates: Analysts currently uphold a Buy rating for Rivian stock with a target price of $19.58. Noteworthy projections from Truist Securities, Cantor Fitzgerald, and Wells Fargo propose a 19.94% upside potential, establishing an average target of $17.67.
RIVN Price Action: Rivian’s stock was priced at $14.77 at the time of writing.
Explore Further: