
The Magnificent Seven and many other large-cap growth stocks were among the winners in 2024. However, in 2025, investors are shunning the largest market cap growth and highest-beta stocks and moving into value, particularly large-cap value.
Shifting investor preferences to large-cap value from large-cap growth and high beta provides an excellent example of sector and factor rotations. Investor rotations between sectors and factors are constantly occurring. Successfully navigating these rotations is one way to beat the market. This, of course, makes a big assumption that you can successfully gauge sector and factor rotations before most other investors.
This article highlights several tools we use regularly to track sector and factor rotations. These models help us better forecast tomorrow’s possible rotations and try to stay a step ahead of the market.
Growth To Value
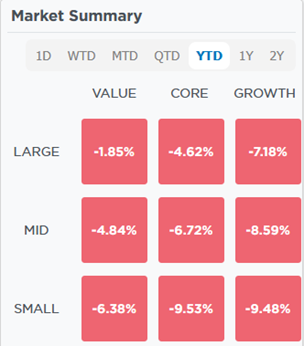
There are many clues that value is now in vogue, and growth has given up its throne. For instance, on the SimpleVisor home page, you will find the table below. It is a simple but telling comparison of market performance by growth/value and market cap. As it shows, all nine combinations of size and valuation are down year to date. However, the decline in the large-cap value factor is much less than that of the other categories. Conversely, large, mid-and small-cap growth are among the worst performers.
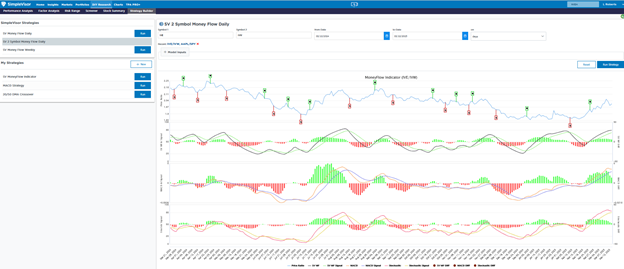
The screenshot below using as the large-cap value proxy and as the large-cap growth proxy further confirms the outperformance of value versus growth. The line graph at the top of the graphic shows the price ratio of IVE to IVW. Below it, we apply three technical indicators to the price ratio.
Think of this as a long/short pair trade analysis. The price ratio (IVE / IVW) has steadily risen since mid-February after trending steadily lower for the last year. The first technical indicator below the ratio graph is our proprietary oscillator. The commonly followed MACD, and stochastic models are below it. All three indicators show the ratio is getting decently overbought. Further, the green/red bars beneath each graph show the indicators, and their respective signals are converging. Thus, a sell signal is likely to come if they flip.
The graphs foreshadow the potential for rotation back to growth from value.
Relative and Absolute Analysis
The data we share above is the tip of the iceberg regarding what SimpleVisor offers regarding rotation analysis. Next is a tool we use daily to help track which sectors and factors are overbought and oversold on a relative and absolute basis. Furthermore, it graphs the rotations to appreciate their trend better and anticipate what may come next.
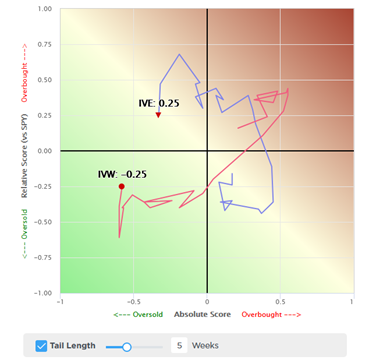
Our proprietary model uses fourteen technical indicators to generate a technical score ranging from 1.0, the most overbought, to -1.0, the most oversold. Generally, we consider a score above or below +/- .80 extreme and unsustainable. In those cases, an absolute or relative trend change becomes likely. The absolute score uses the price of the individual sector or factor to quantify it. The relative score is based on the price ratio of the sector or factor’s price to the . For instance, IVE, as shown below, has a relative score of +0.30, denoting its overbought versus the market. However, its absolute score is -.38, as its price is oversold. Simply, it is declining but not as much as the market.
The screenshot below highlights the absolute and relative scores for the 21 factors we track. As the chart shows, high beta is the most oversold factor, and gold miners are the most overbought on a relative basis. Gold miners are also the most overbought on an absolute basis, while the quality factor () has the most overbought absolute score.
On the right and beneath the table, we chart the five-week progression of the absolute and relative scores for IVE (large-cap value) and IVW (large-cap growth). The rotations over the last five weeks are clear when presented in this manner.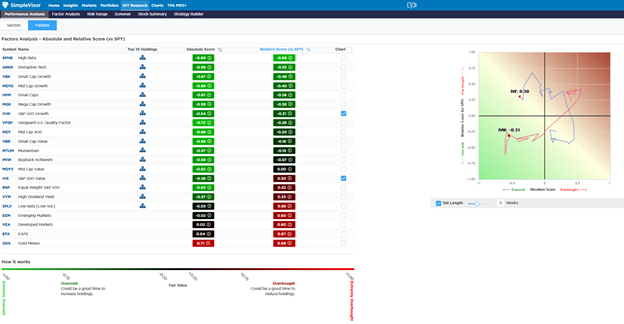
Seeking Other Pair Trades
Now, we move on to tools that provide statistical correlation analysis between two sectors or factors. The table below uses excess returns for every pair of factors and sectors to quantify their correlations over multiple periods.
We circled the correlation between the excess returns of IVE and IVW in red, which is .97. Such a high correlation implies that when one factor outperforms the S&P 500, the other underperforms it. Other extremely high correlations are circled in blue.
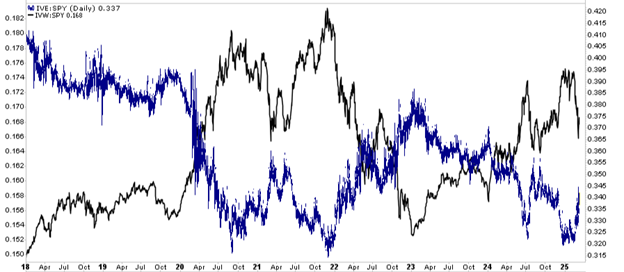
The graph below the table shows the excess returns of IVE and IVW. As the correlation implies, they are nearly mirror images of each other.
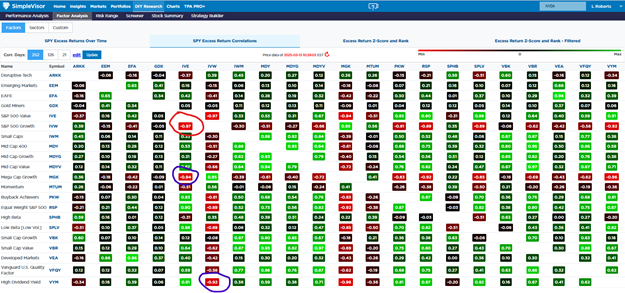
The SimpleVisor table above can be challenging, so it also has a scanning tool to help find relationships with high correlations. We scanned all the possible pairs of stock factors for any statistical relationship with a robust correlation of less than -.90. The correlations are shown in the second column. To the right, we see the percentile the current correlation is over the three time periods in relation to all instances for the specific period.
For example, IVE versus IVW is near the peak correlation over the last 21 days but only about mid-point over the previous 252 days. The relationship has strengthened. The other pair trades listed similarly show a very high correlation and provide more evidence of the roation to growth from value. If you think growth is getting ready to outperform value, the list offers more options than IVE and IVW.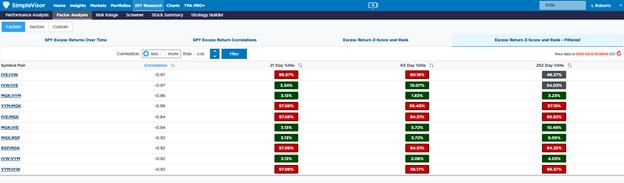
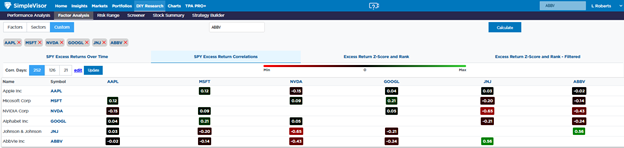
All of the analyses we share above can also be done for a customized list of stocks as we share below.
Summarizing The Value Rotation
The SimpleVisor data clearly shows a significant rotation from growth to value. What also stands out is that value is getting overbought compared to growth. It’s too early to call an end to the growth-to-value rotation, but the rotation will likely take a break, likely favoring growth. The rotation back to growth may last a short while, or the trend of 2024 may reassert itself for months.
The beauty of the analysis is that we can see in real-time how sectors and factors are rotating and when they get extreme. We do not have to rely on the media to tell us what is in and out of favor.
5 Stocks Our Experts Predict Could Double In the Next Year
By submitting your email, you'll also get a free pivot & flow membership. A free daily market overview. You can unsubscribe at any time.