Oracle Corp ORCL will be reporting its second-quarter earnings on Monday. Wall Street expects $1.48 in EPS and $14.12 billion in revenues as the company reports after market hours.
The stock is up 66.50% over the past year, 53.97% over the past six months.
Let’s look at what the charts indicate for Oracle stock and how the stock currently maps against Wall Street estimates.
Read Also: Oracle Gears Up For Q2 Print; Here Are The Recent Forecast Changes From Wall Street’s Most Accurate Analysts
Oracle stock is riding a strong bullish wave ahead of its second-quarter earnings, with the stock trading above its five-, 20- and 50-day exponential moving averages — a signal of sustained buying pressure.
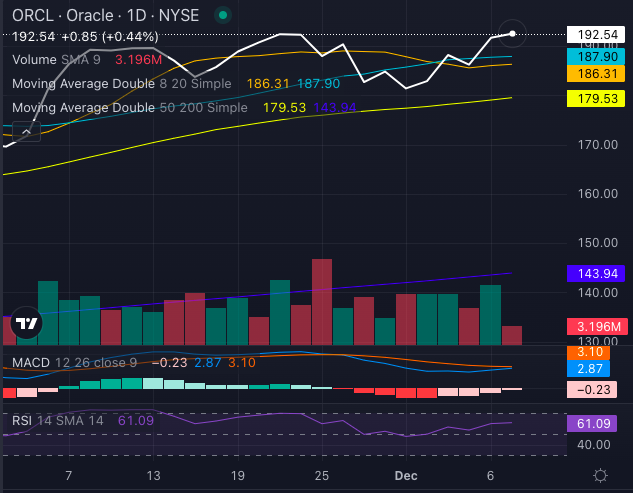
Chart created using Benzinga Pro
The eight-day simple moving average (SMA) at $186.31, 20-day SMA at $187.90 and 50-day SMA at $179.53 all position ORCL’s stock price of $192.54 amid bullish signals.
Additionally, the moving average convergence/divergence (MACD) indicator at 2.87 underscores momentum in favor of further upward movement. However, with the rising relative strength index (RSI) at 61.09, the stock is nearing Overbought territory, suggesting potential caution for traders monitoring any post-earnings volatility.
Ratings & Consensus Estimates: The consensus analyst rating on Oracle stock stands at a Buy currently with a price target of $170.67. Recent analyst ratings from RBC Capital, Guggenheim and Jefferies have an average price target of $201.67.
ORCL Price Action: Oracle stock was trading at $189.60 at time of publication Monday.
Read Next:
Photo: Shutterstock
Market News and Data brought to you by Benzinga APIs